 ®
®Assess
Site Appraisals
Drop a pin, draw the red line, and the site builds itself: constraints, the appeals around it, a branded PDF at the end. Planning history imports from the register and the app structures it. Minutes to a checked picture of a site, not hours searching different websites.
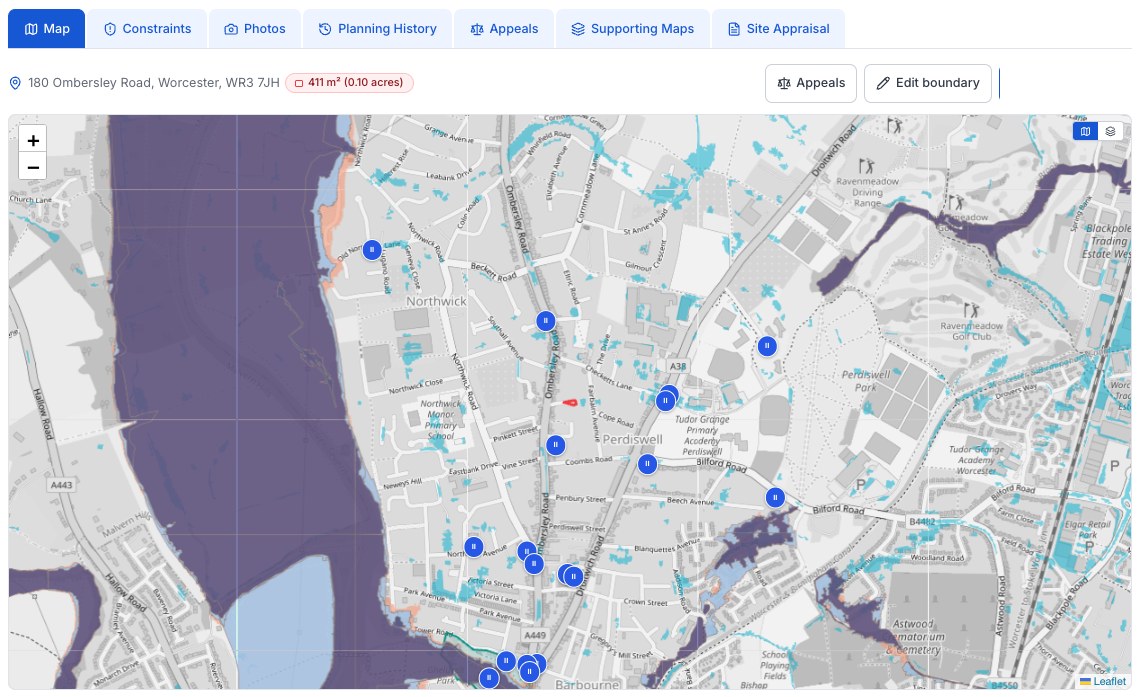
Constraints checked
Flood, heritage, ecology, green belt, nutrient neutrality and more, from the official sources, each shown with its origin.
Planning history without retyping
Import from an LPA register or a screenshot; the app reads and structures it.
Geotagged photos
Where you stood and what you saw, plotted against the boundary, straight into the appraisal.
Appeals around the site
Every located decision within your radius, from every year on record, letter a tap away.
Documents with the site
Decision notices, drawings and correspondence kept against the site, synced to every device.
The branded PDF
The whole site in one client-ready document, under your practice branding.
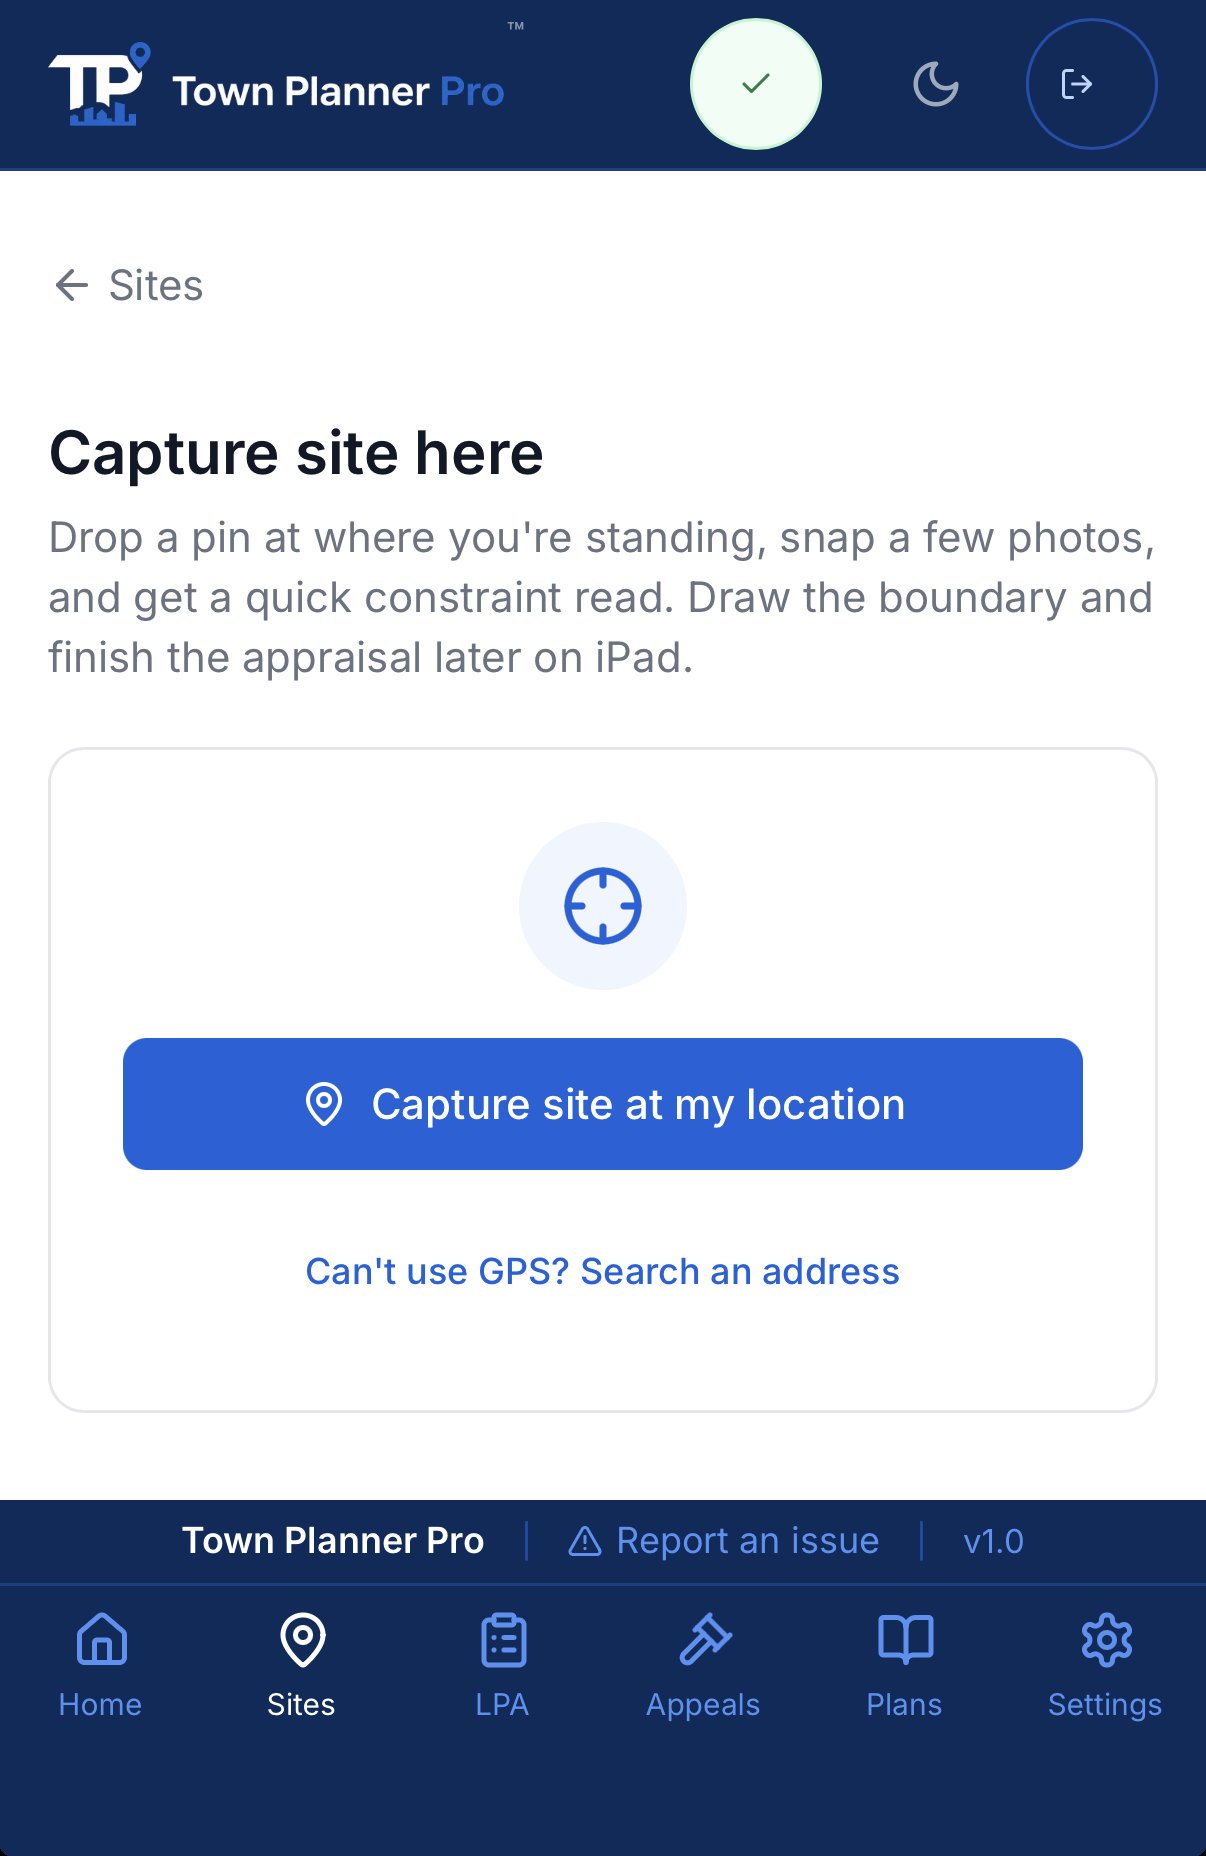
Capture on iPhone
Standing on a site? Capture it in seconds.
Open Capture and the phone does the rest: location, postcode and authority from where you are standing, photos attached from the start. It is waiting at your desk to be worked up properly.
- Drop a pin from GPS, or search an address
- Postcode and authority resolved for you
- A first read of the constraints on the spot
- Finish the boundary later on the iPad

Town Planner Pro
On iPhone
The checks
Each constraint, carded with its evidence
A map, the finding, and a one-tap link to the official source it came from.


Transport
The Framework's transport tests, measured on the site
The new NPPF asks precise questions of a site: is it within 800 metres of a station, does the service meet the frequency test, and which density expectation follows. The card answers each limb with measured figures, and states the policies engaged as considerations, not a verdict.
- Station catchment at 800 metres, the service-frequency test measured from timetables: overall and busiest direction
- Bus stops and weekday frequencies within 400m and 800m, from Bus Open Data
- The density expectation that follows, stated with the policy it comes from
- Travel to work area position, National Cycle Network routes, nearest stations and stops with distances

Appeals around the site
What have Inspectors decided around here?
Pick a radius and every located decision on record appears, from every year, nearest first, with outcome, distance and the letter a tap away. Precedent as a constraint layer.
